Todays installment looks at collecting some basic data regarding the spring rates of the individual components contributing to the overall spring rate of the suspension. While I am in this mode, I will look at both ends of the car. Specifically, I want to know how closely the Swift and Ohlins springs match their published rates. Also I am interested in knowing what the spring rate is of the gas-spring components of the dampers, and of the bump stops.
First, some comments about units, because I use a combination of both metric and Imperial as suits the occasion. Anything measured with a tape measure, I am likely to measure in mm hence ride heights are in mm (from the fender lip to the wheel centre). Most other things measured in mm will probably end up getting converted to inches. Weights I use lbs, so spring rates are lb/in.
To split a hair, there is a difference a pound mass (lbm) and a pound force (lbf), but as one lbm weighs one lbf it is a hair that seldom needs splitting. When it comes to metric though it is worth clarifying how spring rates are usually written. I am using a 120 rear spring and a 60 front spring. It is not uncommon to see these numbers referred to as 12 km/mm and 6 kg/mm respectively. This assumes a convention of 1 kg (mass) weighing 1 kg (force), which if it were the metric convention would be fair enough. Actually though 1 kg (mass) weighs 9.8 Newtons (force). This is close enough that 120 Newtons/mm spring rate looks a lot like 12 kg/mm spring rate, but that would lead to an incorrect conversion to lb/in.
1) The Rear Springs:
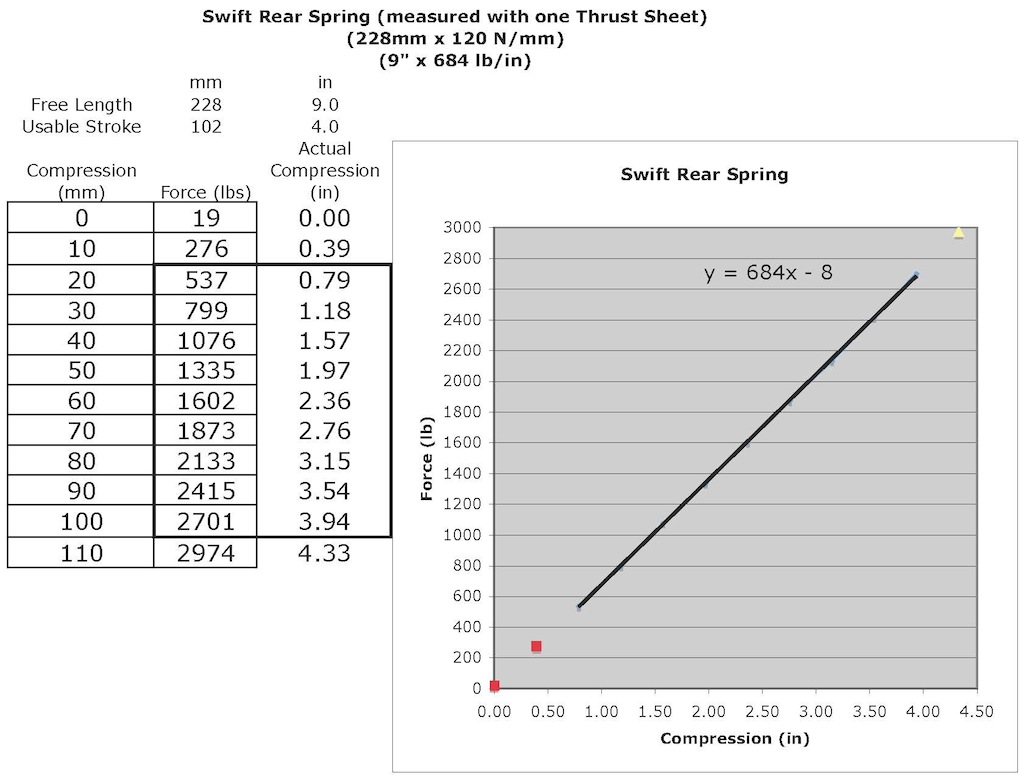
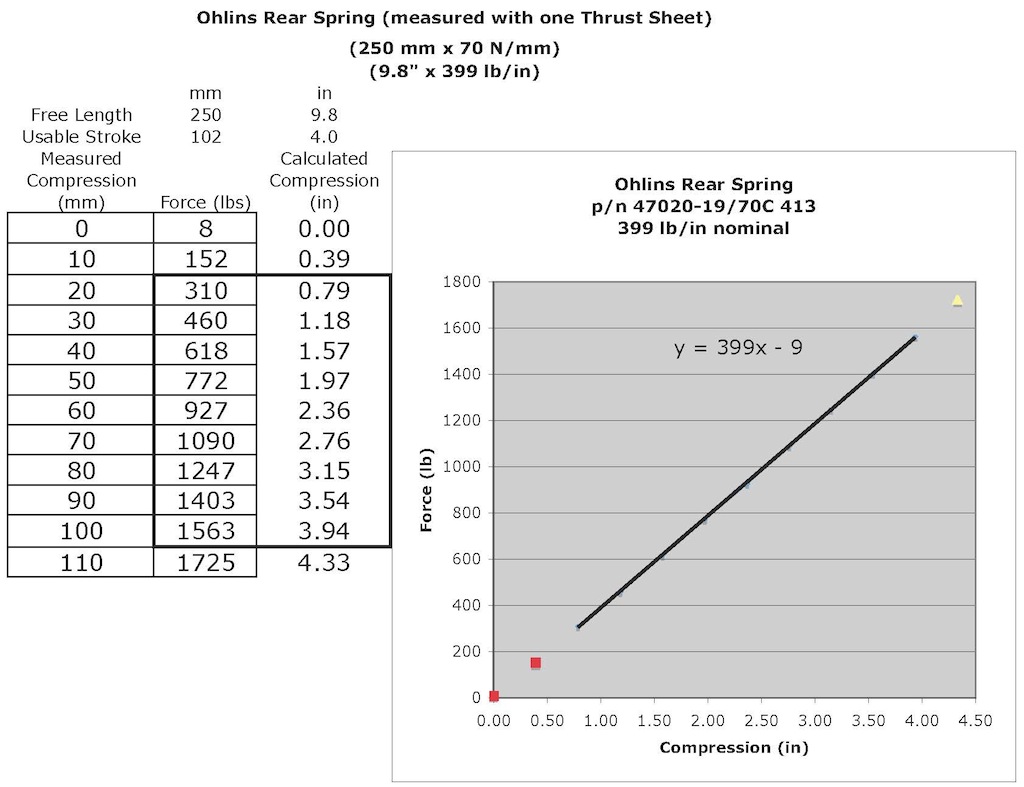
My test rig consists of a 50-ton hydraulic press, two machined flat spring perches, a 5000 lb digital platform scale and a tape measure. I set the perches at the nominal spring length apart and then measure spring force at 10 mm intervals up to just beyond what I know or believe to be the maximum usable stroke. I use one Swift thrust sheet. The scale is zeroed with everything in place but no load on the spring so that the scale reads spring force directly. I plot all the data and then use a linear regression line from 20 mm to the second last data point to find the average spring rate. It is common practice to ignore the first bit of spring travel because springs are non-linear in their initial stroke as the end coils get themselves seated on the spring perches. I will let you draw your own conclusions from the data, but all the measured spring rates were within 0.5% of nominal.
A) Swift Rear
p/n: Z65-228-120
free length: 228 mm (9.0)
nominal spring rate: 120 N/mm (684 lb/in)
usable stroke: 102 mm (4.0)

B) Ohlins Rear (not used)
p/n: 47020-19/70C 413
free length: 250 mm (9.8)
nominal spring rate: 70 N/mm (399 lb/in)
usable stroke: 102 mm (4.0)

C) Ohlins Front
p/n: 47010-15/60C 393
free length: 200 mm (7.9)
nominal spring rate: 60 N/mm (342 lb/in)
usable stroke: 102 mm (4.0)


2) The Rear Bump Stops:
The rear bump stops were tested similarly to the springs using a fixture designed for the purpose. Both the OE rear bump stop and the Ohlins rear bump stop were tested. The bump stops are both dampers and springs so the measured forces are dependent on both rate of application and speed of reading. If you press and hold the bump stop the load gradually relieves itself as the stop dissipates the energy of compression. To keep things consistent, the stops were loaded at about 1 mm/second rate, the load reading taken as soon as the scale stabilized (about 5 seconds) and then the next load added without delay. The stops were tested to a stroke depth of 2/3 of their overall length. There is substantial hysteresis in the load graphs, indicative of their function as dampers, and the bump stops are highly non-linear in spring rate, which suits their function as stops of last resort.


The above graph shows the load curves relative to compressed dimension and forces at the bump stop. It is actually more interesting to translate the two curves and plot them relative to ride height and to relate the bump stop loads to corresponding wheel loads. This requires knowing all the motion ratios calculated previously and the geometries of the OE and Ohlins rear shocks. Being able to answer the how it works and the why it works is why all the data collection is necessary.

What should be apparent is that while the OE bump rubber is initially very soft and is active even at ride height, its net effect is similar to the Ohlins bump stop in that it limits rear suspension travel but it does so earlier in the suspension travel. Based on differences in the Ohlins and OE shock geometries, the Ohlins shock permits more bump travel, as befits a lowered car. It also provides for a more linear overall wheel rate by staying out of the picture most of the time.
3) The Rear Shock:
Some of the rear sprung weight is supported by the gas spring component of the rear shock. As this relieves the main spring, it is important to know what the associated spring rate is. The answer may be surprising to you. Gas pressure inside the shock acts on the cross-sectional area of the piston shaft (not on the piston itself when static pressures are balanced across the piston). The gas pressure increases as the shock is compressed and the gas volume is decreased by the volume of the piston shaft. That volume change is actually quite small relative to the total gas volume and so the gas spring behaves like a zero-rate (constant force) spring, the same force needed to hold it compressed at any depth. This is contrary to ones perception as one compresses a shock by hand, but the work is mostly going irreversibly into the damper, not reversibly into the gas spring. To minimize the time required for fluid forces to balance across the piston, the shock was tested with the damping set at minimum.

The rear shock gas spring force ranges from 35 lbs extended to 38 lbs compressed.
4) The Front Strut:
The front strut incorporates an internal bump stop as it is an inverted monotube design. As such the bump stop is neither accessible nor visible. The point at which it comes into play is readily apparent when compressing the strut by hand. Its construction and stroke limits can only be inferred by its physical characteristics. As with the rear shock, the gas spring is virtually zero-rate, constant force. The bump stop behavior is quite different from the rear bump stops. The front bump stop exhibits two distinct knees with a constant rate in each section of travel. This is indicative of a true spring as opposed to an elastomeric damper. I speculate that the stop consists of a stack of two different Belleville washers


Whats next for the rear suspension? I have got a handle on most of the individual elements of the rear. Next I want to measure wheel rates directly. By comparing those measurements to what should be contributed by the spring, the shock and the bump stop, it should be apparent how much the suspension arm bushings and any potential binding are contributing to the overall wheel rate. And then, on to the front