In this installment I gather some tire spring rate data, and examine how the rear suspension installation geometry introduces nonlinearity to the wheel rate despite a linear rear spring and a rear spring motion ratio that are essentially constant with ride height.
The rear suspension ride rate (the effective spring rate for the unsprung rear corner weight when exposed to pure vertical motion) sees contributions from the following springs:
- the suspension spring
- the gas spring component of the shock
- the bump stop (over part of the suspension travel)
- the rubber suspension bushings
Because each has its own individual load path between the wheel and the chassis they are said to act in parallel, and their individual spring rates sum to calculate the total rate. Using an electrical analogy, parallel springs are treated like series resistors when calculating total spring rate and total resistance respectively.
Earlier installments have measured all of the above rates and their respective motion ratios, except for the rubber bushing rate.
The other significant spring acting between the suspension and the ground is the tire. It acts in series with the suspension springs. All load passing through the tire also passes through the parallel springs so both contribute to the total ride motion. It should be clear then that two springs acting in series are softer than either one spring alone. Accordingly, the tire reduces the overall spring rate of the vehicle. Since tire rate data is not generally published, I thought it worthwhile to get some representative measurements at a range of tire pressures.
The tire I chose is a Dunlop Direzza ZII 224/40R18 on an 8.5 wheel. The method is to apply a load to the top of the tire and measure the reaction at the bottom of the tire, while measuring tire deflection.


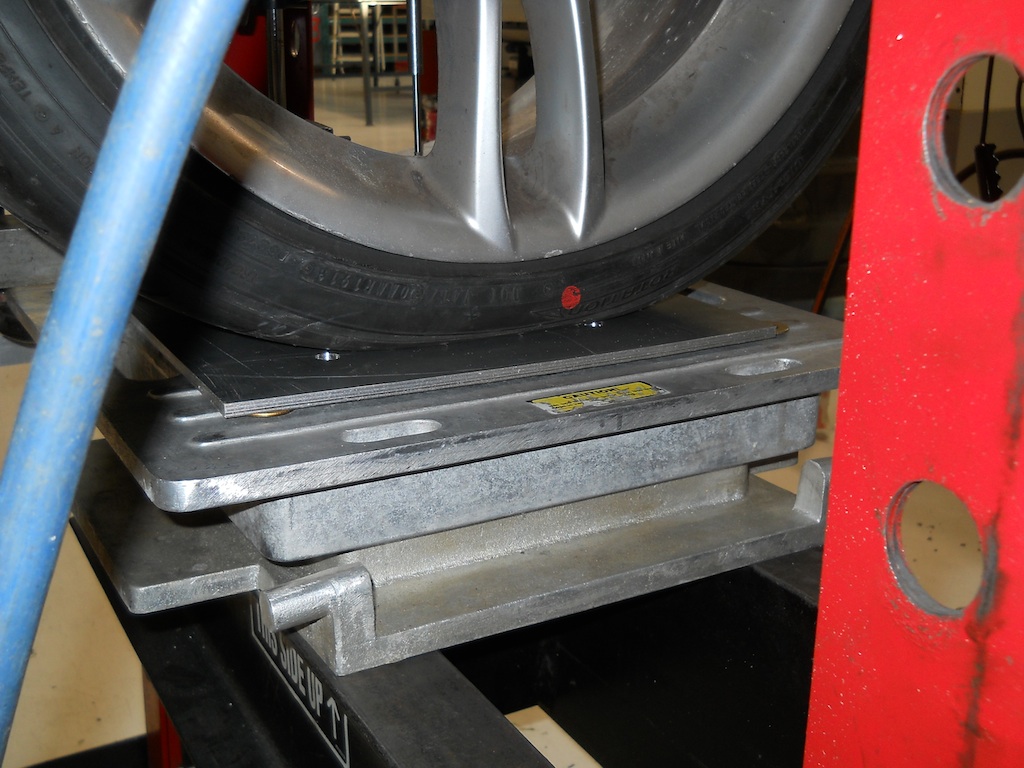
Load was increased from zero to approximately 1800 lbs in approximately 200 lb increments. The test was repeated at 30 psi, 35 psi, 40 psi and 45 psi no-load tire pressure and the tire pressure was also measured with full load to observe how much it increased with load. Deflection was measured with a dial indicator accurate to 0.001 inch.

Generally the tire rate was progressive until about 400 lbs applied load and then it became constant. The effective spring rate of the tire has been calculated using linear regression in the range from 400 lbs to 1800 lbs applied load. The air pressure in the tire increases by only about 1.5 psi between 0 and 1800 lbs load in all cases, which is counter to many peoples intuition. It is clear evidence that the air pressure acting over a contact patch area is what supports a tire, not pressure rise due to reduction in internal volume.
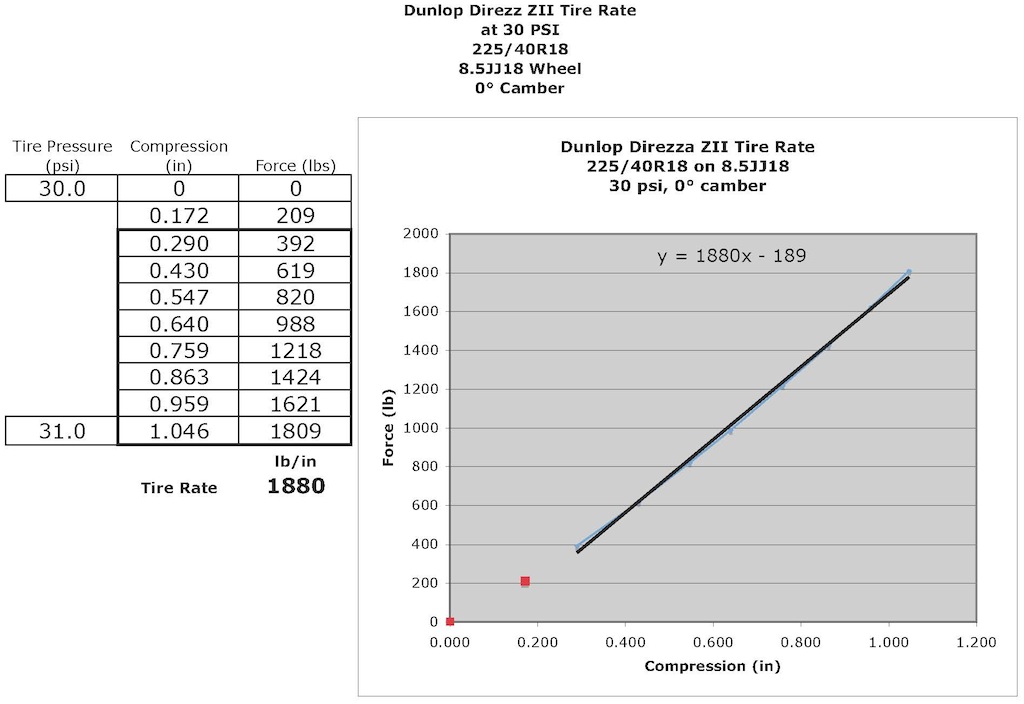

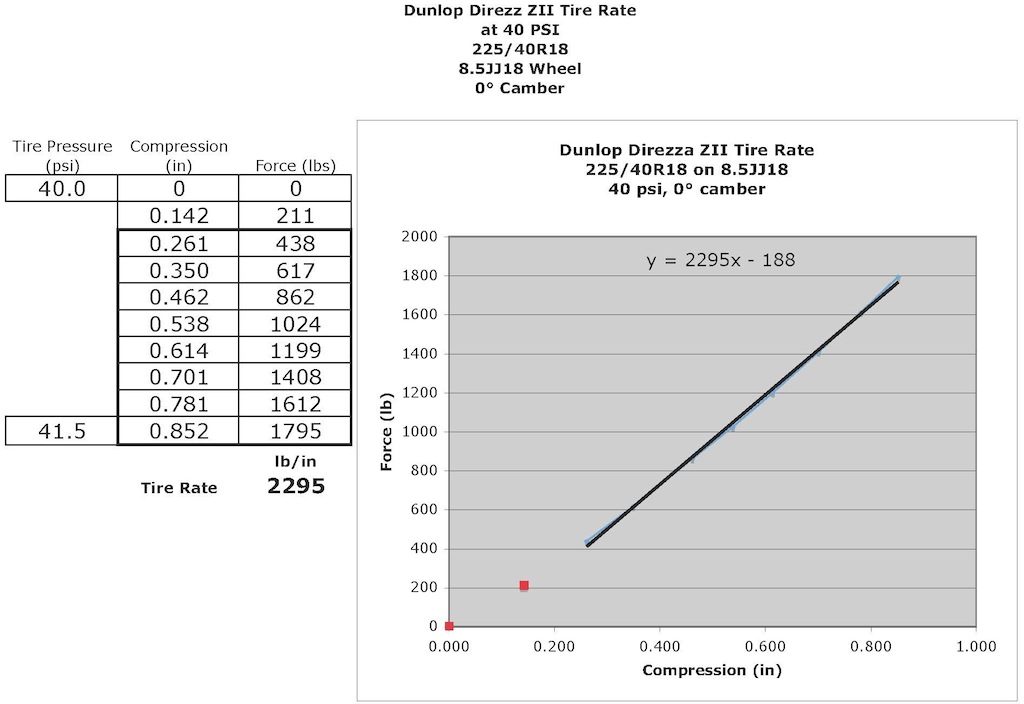
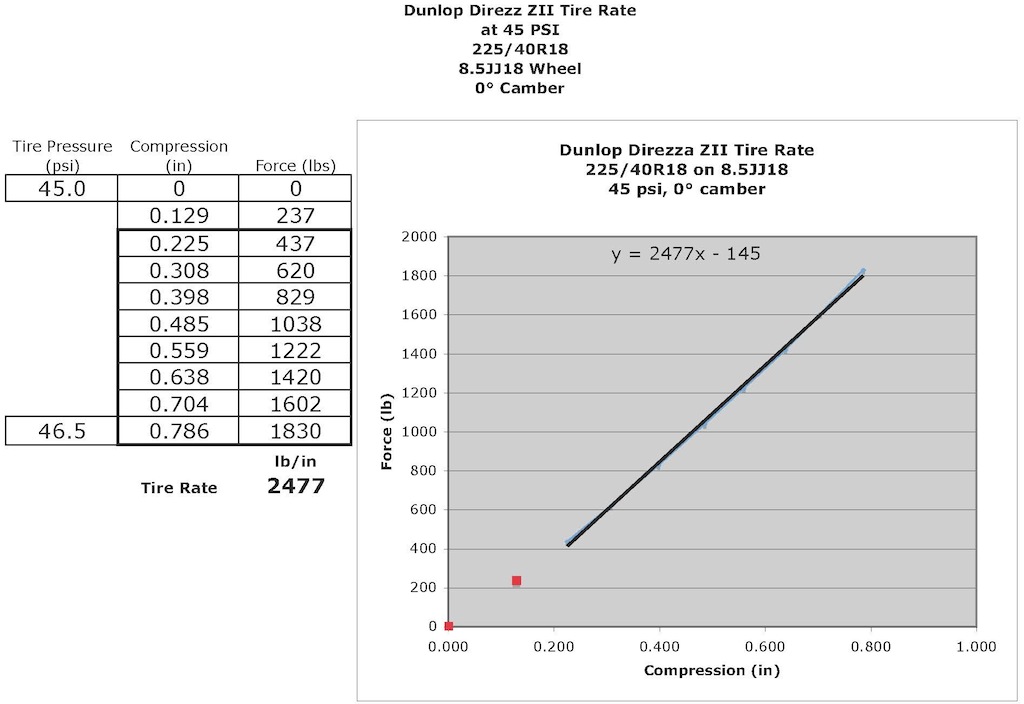
So in round numbers, the tire rate is approximately 2000 lb/in. If the wheel rate due to the effect of all springs was 200 lb/in, the overall wheel rate combining the two would be:
1/WR = 1/2000 + 1/200 = 11/ 2000
WR = 2000/11 = 182 lb/in
This gives a sense of the magnitude of the tire effect, which can be expected soften the overall wheel rate by approximately 10%. Of note, there is the possibility of fine tuning the overall wheel rate by adjusting tire pressure, although the effect will be small.
The question of what effect spring bending has on the effective rate of the main suspension spring remains of interest. We have previously confirmed that the suspension spring accurately matches the published values with respect to overall length and spring rate, and that rate is remarkably linear throughout the useful range of travel. The rocking motion of the lower camber arm and the bending it imparts on the spring can only detract from its linearity.
We are now in a position to measure the wheel rate due to the main suspension spring only by measuring the vertical wheel reaction vs. wheel (ride) height. The following precautions are necessary:
- chassis is supported on jack stands
- shock (and of course bump stop) is removed
- bolts are loose to relieve rubber bushings
- scale readings are adjusted to remove the unsprung weight
- anti-roll bar disconnected
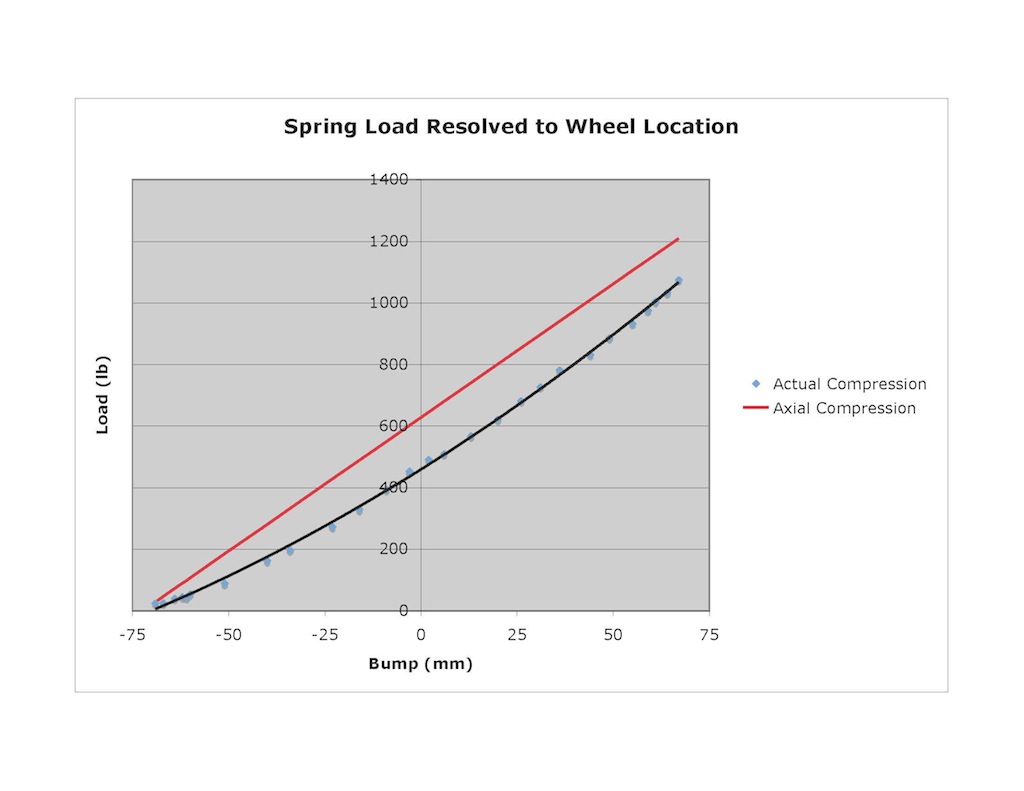
Because of the data previously collected, the wheel height can be directly correlated to the spring length as measured on its centerline. From the measured spring rate and spring motion ratio the theoretical spring load can be calculated for purely axial spring compression. This can be resolved to the wheel location using the square of spring motion ratio.
The following graph shows the wheel rate expected if the spring compression were purely axial in red. The blue dots represent data points collected with a black 2nd order polynomial regression line fit to the data. The load value does not include unsprung weight. As can be seen the suspension geometry as pertains to the spring motion introduces a strongly progressive wheel rate despite the use of a linear spring.
At this point, I think we are ready to put the rear suspension together and measure the wheel rate as a function of ride height with all elements acting together. Understanding how each element contributes to the whole should make that big picture clearer.
Those measurements must wait for another day though.