






|
|
|
|
|
| 02-14-2014, 01:26 PM | #1 |
|
Team Zissou

3380
Rep 10,232
Posts |
 Datazap Update! User controllable individual axis
This is a smaller update, but one that I find very useful. If you haven't signed up already, just go here to use this new feature: www.datazap.me
As you know when you first load up a log by default RPM and Boost (if you have boost logged) will be visible automatically. Boost is on the same shared axis as all other data series: 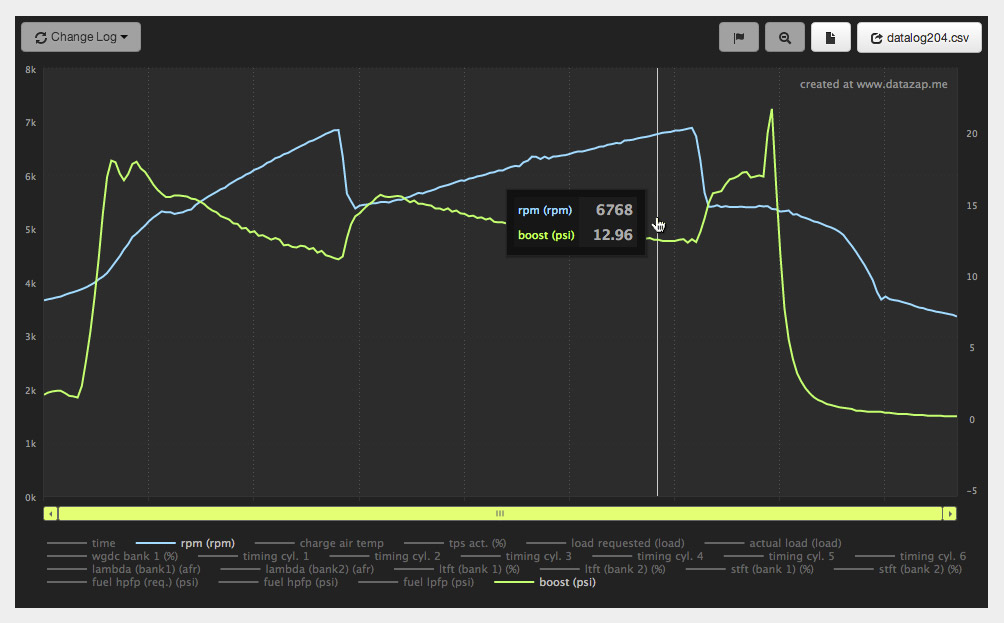 Since the axis is shared, when you turn on data series that have much higher or lower values it can skew the chart - like high pressure fuel pump psi which has numbers in the thousands: 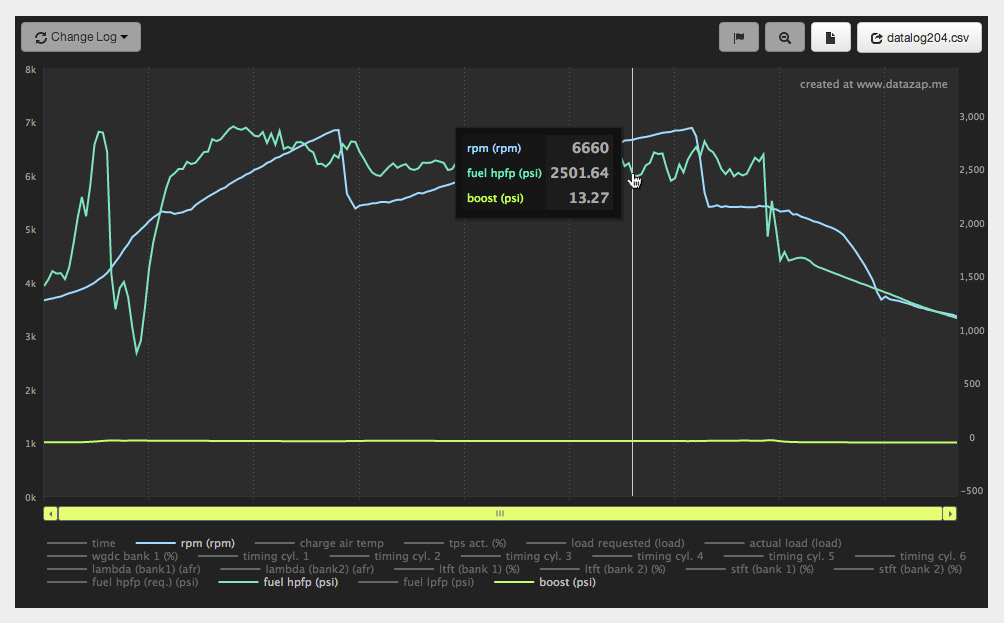 With this new update (which is now live, clear your cache) if you click a line on the chart it puts that data series on it's own axis so it doesn't mess up data that is in a much different range. It's numbers are colored the same as the line color so you can easily tell what it's associated with: 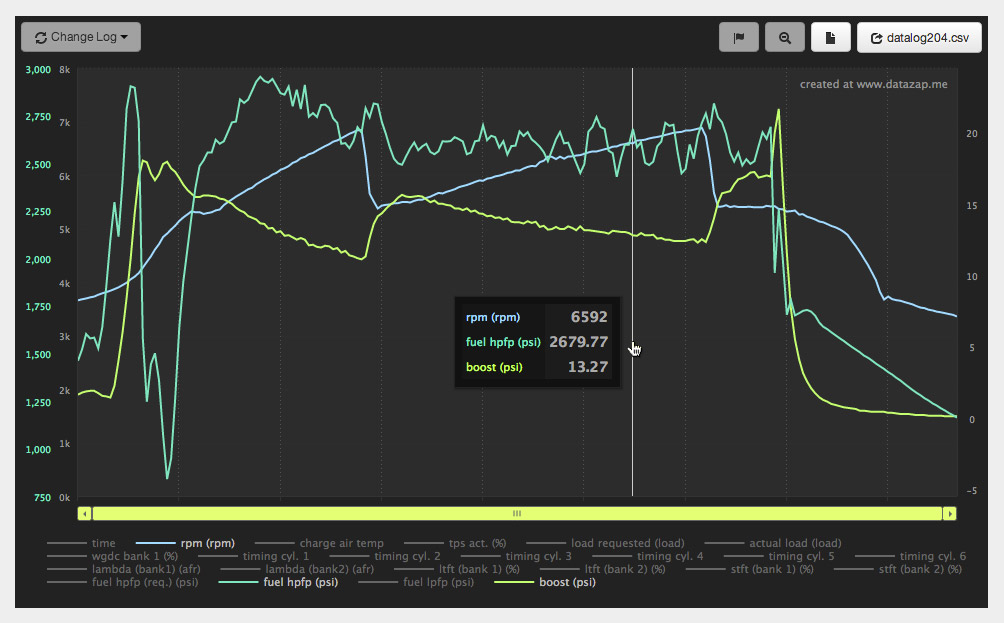 If you click the line again it puts it back on the shared axis. Any data series you've put on it's own axis will load properly when you copy/paste the url to someone. Enjoy! |
Post Reply |
| Bookmarks |
|
|





